The Definitive, No-BS Guide to Increasing Conversions (PHASE V)
PHASE V: CONTENT AND TESTING

Step 9: Copywriting Review
To conduct a copywriting review, gather all of the pages identified as having potential issues in the Google Analytics Content reports. These are the pages with high bounce rates and/or low conversion rates.
Pay particular attention to the value proposition and the traffic that is driven to the page. In some instances, the issue is with the traffic instead of the actual copy on the page.
The copywriting review comes near the end of the process for a reason. At this stage, you should have a solid understanding of the user persona; which will significantly affect how the copy should be written and the words/colloquialisms that should be used.
Remember the user personas you developed or improved in Phase III? Now is the time to revisit those and get primed for developing copy that speaks to your buyers. They will be specially useful for identifying great hooks and developing content that hits and overcomes every objection before asking for the sale.
During the copywriting review, look for the following:
- Is the macro copy, in its current form, helping or hindering the conversion process?
- Is the value proposition easy to find and understand? Does it solve the market’s problem?
- Does the page have a strong headline that captures my attention?
- Does the page have a sub-headline or introduction that peaks my interest and keeps me enticed enough to read more?
- Does the copy communicate value?
- Is it clear and easy to understand?
- Is it free of jargon?
- What can be removed from the copy while still addressing all objections to a sale?
- Is it actually interesting to read?
- Does each line keep me wanting to read more?
After conducting the initial review, hand the copy over to four to six peers to review.
If the content is re-written, conduct a quick copy test.
Copy Test
Rate the following on a scale of 1 to 4:
- You absolutely would not read beyond the headline.
- You probably won’t read beyond the headline.
- You will read on, but with skepticism or doubt.
- You would definitely read on with a high level of interest.
Ask the same questions of the headlines, lead-ins, subheadings, paragraphs and calls-to-action in the following order:
- Headlines
- Lead-ins
- Subheadings
- Paragraphs
- Calls-to-action
If the rating is below 3.2, the copy in that specific area should be revised. Copy marked for revision is further evaluated using the VCC Test.
VCC Test
Value – What’s in it for me?
Clarity – Is it simple and clear, can we make it shorter?
Credibility – Is it believable?
Every piece of copy that scores below 3.2 is revised until it achieves a “yes” on all three parts of the VCC test. The copy is then subjected to another peer review.
There is a lot more that can be done to evaluate the site’s copy; such as looking at testimonials, guarantees and benefit/feature driven bullet points. However, in the case of conversion optimization, we only focus on the top 20% of the copy that will lead to the biggest uplifts in conversions.
If, after a page is optimized, it comes up again as one that could be revised further to increase conversions, begin looking at the other areas and tweak the copy to suit the target market using stricter parameters.
With the Quantitative, Qualitative, Copywriting Review and Research complete, compile a Conversion Research Report. I use Peep’s Conversion Research example (need to be a student of his conversion course to access it) to format the report in a style that is easy to understand.

Step 10: Sorting: What I should test first?
With all of the areas affecting the conversion rate identified, each must be ranked in order of importance to establish priority.
To objectively rank which tests should be done first, rely on a mix of working on ease of implementation of the test and potential income increase. Rank each of these areas on a scale of 1 to 5 before bringing the list to the business.
The ranked issues are placed on the Hypotheses and Test Plan Sheet to create hypotheses and tests based on which changes are going to have the greatest impact on increasing sales.

Step 11: Hypotheses and Test Plans
With a clear listing of the most important pages to test, begin creating hypotheses around what needs to be tested and begin writing the test plans for these hypotheses.
To formulate the hypothesis, put together a problem page that lists all of the possible solutions that will achieve the desired outcome.
Use the following formula to quickly create a hypothesis for any problem:
Example:
Problem: The form on the contact page is converting low. Visitors are finding it difficult to identify which fields are required.
Proposed Solution: Let’s add some more descriptive macro copy to the form, change the copy above the opt-in and the overall presentation so visitors will better understand how to fill out the form and the form will stand-out on the page.
Hypothesis: By improving the clarity of the form macro copy and overall presentation on the opt-in, visitors can easily spot the form and have a better understanding of what is required of them the first time around; because of this we will increase the number of leads.
After working out the problems, the proposed solutions and the hypotheses for each potential test, add each to the ranked problems on the Hypotheses and Testing sheet. Re-run each identified issue through the PIE framework to determine which test to run first since the proposed solutions may impact implementation.
PIE Framework
The PIE framework was created by WiderFunnel and evaluates the effectiveness of a test by looking at potential for improvement, the importance of the page (does it get high traffic) and how easy it is to implement the test. All the categories are based on a ranking of 1 to 10.
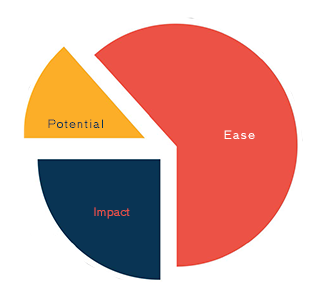
The results are evaluated using the PIE formula:
(Potential + Importance + Ease) /3 = PIE
Rank the Test Types from the highest PIE rating to the lowest PIE rating. Present the findings to the client or project manager.
P + ICE + T Framework
The PIE Framework is fantastic but so are Sean Ellis’ ICE Score and Brian Balfour’s (former VP of Growth at Hubspot) Time and Resource Factor. Since optimization is all about bringing together the best to create the best – I optimized my testing process.
| P – | Potential | I – | Impact |
| I – | Impact | C – | Confidence |
| E – | Ease | E – | Ease |
I combined the ICE Score with the Time and Resource Factor to create ICET, the love child of Sean Ellis and Brian Balfour then combined that with the PIE Framework. ICE Score and PIE Framework are very similar but Brian Balfour turns Potential/Confidence into a measureable data point by assigning a prediction percentage.
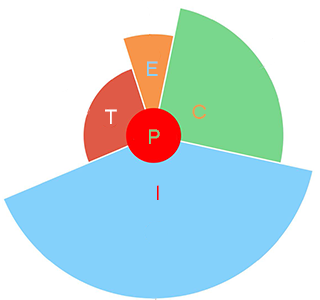
In the end, we have PICET:
P = Prediction
I = Impact
C = Confidence
E = Ease
T = Timeframe
In practice, calculate the ICE score by itself and use Prediction and Timeframe to evaluate what should be tackled first.

Step 12: Test
Finally! Time to do some testing!
Note that when conducting testing, it is important to ensure that the sample size is statistically significant. A good ballpark figure is 250 conversions per variation before reaching statistical confidence. This number is influenced by the market and website, obviously, but I wouldn’t go any lower than that 250 when conducting analysis.
To determine a statistically relevant threshold, use this super simple calculatorthat reveals what your sample size should be in advance.
In addition to statistical confidence, pay close attention to the margin of error. All error margins need to have gaps between them and not overlap.
You will see a “margin of error” when a conversion program provides a variation result like 44.0% (+/- 7.38%); this means that the real conversion rate could be anywhere from 36.62% to 51.38%. That is a major deviation. Ideally, the margin of error should be 1 to 2 deviation points. Need more math? Click here Peep Laja’s take on A/B testing statistics.
Simply measuring the conversion rate increase is not enough. You need to understand how each variation impacts cash flow. A test might convert less on the front end but make more income in the long run. It’s important to know how much money is made on the front end and the total lifetime value.
I recommend using a 30-day evaluation to determine lifetime value.
Note: To the greatest extent possible, separate tests using A/B Split testing and only use multivariate tests on sites with huge traffic numbers. I recommend doing an A/B split test first and then conducting a multivariate test when you need to test multiple items on a specific page after having a few successes with the A/B split test.
Only run tests in full week sets. If the test starts on Monday, end it on a Monday. This accounts for the fluctuations in conversion rates that occur on a day-to-day basis and ensures that those fluctuations do not influence the results.
Measure the results of testing against the data in Google Analytics for specific segments and categories. At face value, a variation might be failing when compared to the average conversion ratio; however, the variation may be killing it in a specific region or target market when compared to all other variations.
AVERAGES ALWAYS LIE! – Click to tweet
Extra Resources
Throughout this book you’ve found links to resources that provide extra insight on each of the aspects of CRO but if you’re like me you are still thirsting for more. In addition to my next massive guide on growth marketing, here are few more sources to keep your CRO muscles toned.
Don’t forget to sign-up here to be notified as soon as my growth marketing guide is available…trust me, you don’t want to miss it!
Blogs
- ConversionXL
- Unbounce – The Landing Page and Conversion Optimization Blog
- Buffer – Thoughts on Social Media & Online Marketing
Books
- You Should Test That: Conversion Optimization for More Leads, Sales and Profit or The Art of Science and Optimized Marketing by Chris Goward
- Website Optimization: An Hour a Day – A Conversion Rate Optimization and A/B Testing Guide by Rich Page
- Landing Page Optimization: The Definitive Guide to Testing and Tuning for Conversions by Tim Ash
YouTube Channels
See Phase VI: Results and Repeats here.
The Definitive No-BS Guide to Increasing Conversions
How to Kill It in the Conversion Game
100% Privacy. No BS. no games, no spam, When you signup.
we’ll keep you posted with a few emails per week